17. Data acquisition and detector monitoring Appendix Detector
Having introduced the detector used for the data taking in chapter 7, this appendix introduces the data acquisition (DAQ) software for the detector (sec. 17.1 and 17.2), discusses the data formats used for readout as well as the logging facilities. In the last section 17.3 we will discuss the event display tool used to monitor daily data taking at CAST.
17.1. Timepix Operating Firmware - TOF
Starting with the firmware of the detector, the \textbf{T}imepix \textbf{O}perating \textbf{F}irmware (TOF), which runs on the Virtex-6 FPGA, specifically a Xilinx Virtex-6 (V6) ML605 evaluation board. TOF controls the Timepix ASICs of the Septemboard (both the slow control aspects and data taking) as well as coordinates the scintillator signals and FADC trigger. It is a VHDL project, intended to run at a clock frequency of \(\SI{40}{MHz}\). Communication with the GridPixes is done via two \textbf{H}igh-\textbf{D}efinition \textbf{M}ultimedia \textbf{I}nterface (HDMI) cables, while communication with the readout software on the DAQ computer is handled via Ethernet. For a detailed introduction to TOF, see (Lupberger 2016) as well as (Schiffer 2024).
See sec. 18.2 for a few notes on the used firmware versions during data taking.
17.2. Timepix Operating Software - TOS
The \textbf{T}imepix \textbf{O}perating \textbf{S}oftware (TOS) is the computer-side data acquisition software to read out Timepix based detectors. It is an object oriented C++ project, available at (“TOS - Timepix Operating Software,” n.d.). 1 The project needs to be used in conjunction with the \textbf{T}imepix \textbf{O}perating \textbf{F}irmware (TOF), which communicates with TOS via Ethernet. The TOS project started as far back as 2009 by people at the University of Mainz. Next is a short overview over the basic blocks that make up the main logic of the software.
The fully object oriented nature of the project means that there are different classes for the different software pieces:
-
Console - A class representing the user facing REPL (Read-Evaluate-Print Loop, an 'interpreter') to control the software
-
PC - A class representing the network layer and communication side of the software, sitting between the console and lower layers.
-
FPGA - A class representing the functionality required to control the FPGA on the Virtex-6 evaluation board.
-
Chip - A class representing each Timepix ASIC and its functionality.
-
HFManager - A class unifying the FADC & Wiener HV control unit as
they are both controlled via USB, installed in a VME crate. This
class contains individual attributes that contain explicit classes
for these two devices. The name is shortened for 'High Voltage and
FADC Manager'.
-
V1729 - A class representing the Ortec Flash ADC.
-
HV* - Multiple classes representing HV channels, groups and more.
-
-
MCP2210 - A class representing the PT1000 temperature sensors
installed on the detector via a
MCP2210micro controller, optionally connected via USB. The actual micro-controllers with attached PT1000s areMAX31685models. - Misc
- there are a few further classes of minor interest to the general functionality of TOS (tab command completion and history, classes to set masks on the chips, etc.)
In general TOS is a fully command line driven software package, with its own REPL (Read-Evaluate-Print Loop; the name for an interactive terminal process, which takes commands that are evaluated and returns to the terminal). It brings all the expected features one might wish from a REPL, including auto completion, history lookup, emacs style keybindings (based on GNU Readline 2) and more.
The aforementioned HFManager and the temperature sensors are
optional pieces that are not required for basic Timepix
operation. Their functionality has to be activated via a manual
command, ActivateHFM. This triggers the USB connection to the VME
crate and tries to find the Wiener HV module as well as the Ortec FADC
in the crate. Additionally, the temperature sensors are attempted to
be found (via a secondary, optional USB connection). If the latter are
found a continuous temperature logging begins (see
sec. 17.2.4).
The HV controls are specific to Wiener HV power supplies. In principle the implemented functionality is a fully featured HV controller that supports all Wiener functionality like grouping different channels to ramp up together, kill channels on a trip and more. Most importantly, it implements a custom, slow HV ramping logic, which keeps the relative potentials constant between channels in a group to avoid tripping a channel.
An example of a typical startup procedure is shown in listing 1, in this case to start a background run. Note that most essential commands in TOS also have shortened names via numbers, due to historic reasons (TOS originally did not have autocompletion or allowed moving the cursor in text input, making typing complex names cumbersome and error prone), which is why many of the inputs are simple numbers.
  user@ingrid-DAQ~/ ./TOS
  > 7 #   number of chips
  > 4 #   preload
> SetChipIDOffset
  > 190
> lf #   load FSR values for the chips
  > #   return 7 times enter to load default paths
> uma #   create a uniform matrix for all chips
  > 1 #   Matrix settings
  > 0
  > 1
  > 1
  > 0
> LoadThreshold #   load threshold equalisation files
  > 4 #   write matrix
  > 3 #   read out
  > 3 #   2nd readout to make sure pixels are 'empty'
> ActivateHFM #   startup HV & FADC controls
> SetFadcSettings #   load the FADC settings
> Run #   start a data taking run
  > 1 #   run time via # frames
  > 0
  > 0
  > 0
  > 2 #   shutter range select
  > 30 #   shutter time select (2 + 30 yields ~2.2 s frames)
  > 0 #   zero suppression
  > 1 #   FADC usage
  > 0 #   accept FADC settings
17.2.1. TOS output data format
When starting a data taking run with TOS, a new directory for the run
is created in the data/runs subdirectory. The name will be of the
form Run_<run number>_YYMMdd-HH-mm where the run number is an
increasing number based on the last run present in the directory and
the suffix is the date and time of day when starting the run. This
directory contains the configuration of all DACs for each chip,
fsr<chip number>.txt, the written configuration matrix for all
pixels, matrix<chip number>.txt and finally the data files
data<event number>.txt. If an FADC is used for the readout
additional data<event number>.txt-fadc files are created, one for
each file in which the FADC triggered (sec. 17.2.1.1).
The Timepix data files are stored – for historic reasons – in raw ASCII format. Two different readout modes (with different output formats) are supported. For the following explanation it is assumed the Timepix is used in the ToT (Time-over-Threshold) mode.
- full matrix readout
- reads out the whole Timepix ASIC(s) and writes a single 256x256 pixel matrix as an ASCII file (for each chip). 256 lines, each containing space separated ToT values for each pixel.
- zero suppressed readout
- reads out only those pixels that have ToT
values larger than 0, up to \num{4096} pixels. Stores the data in
TSV files (tab separated values) '
X Y ToT' with an additional header. The header contains a global "run" and "event" header, which contains information about the run the event is taken from and a "chip" header, which contains information about the specific Timepix ASIC(s) being read out (up to 8 can be read out at the same time using TOS).
As for our purposes most events are extremely sparse (< 500 pixels
active) the zero suppressed readout is the only relevant readout
mode. The data files can be split into 3 distinct parts. A global run
header, see listing 2, which
contains information about the run the event is part of including
important settings used as well as the timestamp of the event. Next is
an event specific header, which contains specific information about
the event in relation to the FADC and the scintillators, see listing
3. The final part of the
zero suppressed data files is the chip header and tab separated value
part of the 'X Y ToT' pairs of the active pixels for each chip of
the detector in that event, see listing
4.
    ##   [General]
##   runNumber:        339
##   runTime:          7200
##   runTimeFrames:    0
##   pathName:         data/runs/Run_339_190218-10-36
##   dateTime:         2019-02-18.10:36:34
##   numChips:         7
##   shutterTime:      2
##   shutterMode:      verylong
##   runMode:          0
##   fastClock:        0
##   externalTrigger:  0
    ##   [Event]
##   eventNumber:      2
##   useHvFadc:        1
##   fadcReadout:      1
##   szint1ClockInt:   0
##   szint2ClockInt:   0
##   fadcTriggerClock: 647246
    #   chipNumber: 0
#   chipName:   E 6 W69
#   numHits:    0
#   chipNumber: 1
#   chipName:   K 6 W69
#   numHits:    0
#   chipNumber: 2
#   chipName:   H 9 W69
#   numHits:    2
106     160     75
211     142     2
17.2.1.1. FADC data files
If the FADC triggered during an event, as indicated by the
fadcReadout field in the event header seen in listing
3, an additional data file
is written with the same name as the event file, but a .txt-fadc
extension. It contains a memory dump of the channels of the circular
memory of the FADC plus a basic header about the FADC settings and the
information about when the trigger happened.
The different fields in the header, see listing 5, are as follows:
nb of channels: decimal value of a 4-bit field that decides the number of active channels.0corresponds to using all channels as separate. We only use a single channel. 3channel mask: decimal value of a 4-bit field to (de-)activate channels.15corresponds to all 4 channels active.posttrig: how many clock cycles in the \(\SI{50}{MHz}\) 4 base clock of the FADC it continues taking data before commencing the readout (useful to record the rest of the signal and center it in the readout window)pretrig: the minimum acquisition time before a trigger is allowed to happen, in units of the \(\SI{50}{MHz}\) 4 base clock.triggerrecord: together withposttrigallows to reconstruct the time of the trigger in the acquisition windowfrequency: decimal representation of a 6-bit field to select the operating frequency.2 = 0b000010corresponds to \(\SI{1}{GHz}\) operation.sampling mode: decimal representation of a 3-bit field changing the operation mode (manual or automatic trigger) and register working mode (12 or 14-bit sensitivity of each register). We run in manual trigger and 12-bit mode. 3pedestal run: a 1-bit flag indicating whether this file is a pedestal run.
    #   nb of channels: 0
#   channel mask: 15
#   posttrig: 80
#   pretrig: 15000
#   triggerrecord: 56
#   frequency: 2
#   sampling mode: 0
#   pedestal run: 0
The data portion starts with another semi-header of 12 data points, see listing 6. It contains fields that are not explained in the FADC manual, but instead refer to "reserved for expert usage" (CAEN 2010). One exception is data point 2, which is the so called Vernier, which could be used to determine the trigger time within two registers to get up to \(\sim\SI{50}{ps}\) RMS accurate time information. For our purposes though \(\SI{1}{ns}\) time resolution is more than enough, given the signal undergoes integration and differentiation of a multiple of that in the shaping amplifier, anyway.
    #   Data:
#   3928
#   8022
#   3957
#   8076
#   3928
#   8023
#   3957
#   8077
#   2048
#   6138
#   2031
#   6151
The final portion of the file contains the actual data (\(\num{10240}\) lines) and 3 fields at the very end to reconstruct the trigger within the acquisition window 5. The data represents a pure memory dump of the cyclic register. See listing 7 for a shortened example.
  2028 #   register 0, channel 0
6119 #   register 0, channel 1
1999 #   register 0, channel 2
6100 #   register 0, channel 3
2021 #   register 1, channel 0
6108 #   ...
... #   10240 lines of data in total
#   56
#   4096
#   0
- Explanation of beginning of data portion extended
Explanation of the data header 6 here:
hvFadcManager.cppwriteFadcData- FADC manual page 27 lists the data sent by the FADC.
However, neither explains what the "first sample" and the "rest baseline" is. The manual calls these "expert features" and doesn't explain them… That's how you keep it as an expert feature! The second line is the Vernier, that I honestly don't really understand either. I think it allows to more precisely find the time of trigger between two register entries? Ah yes, see page 14 of the manual about the Vernier. Allows for 50 ps RMS time information between two bins.
- Explanation of FADC settings extended
As mentioned in the footnote in the previous section, I really don't understand the choice of FADC settings we used for the actual data taking. It's quite possible I'm nowadays just not aware of something important, but well. Either way, unfortunately I only started being serious about note taking about my work around the beginning of the data taking period in October 2017. So retracing my thoughts during my master thesis (2015-2016) and beginning of my PhD is unfortunately pretty much impossible.
However, as mentioned the settings are good enough for what we are doing with the data. The much bigger issues are related to the noise we observed at times etc., which will be mentioned later.
17.2.2. TOS configuration file
Everything related to the HFManager in TOS is controlled by a
configuration file, normally located in
TOS/config/HFM_settings.ini. The TOS configuration file used during
CAST data taking is found in appendix
18.1. We will go through the
sections of it one by one and explain them.
Starting with the [General] section, listing
8. This section defines the VME related
settings. The VME address of the HV module installed in the crate is
used as the base address. The FADC address in the same VME crate is
calculated from an offset in units of the VME address spacing of
0x0400. 6
  [General]
sAddress_fadc = 1
baseAddress_hv = 0x4000
The next section [HvModule], listing 9, are
general settings about the used HV module. The settings are related to
the KillEnable feature of Wiener HV power supplies, the ramping
speed of the HV channels and the time in seconds between sanity checks
of the HV during data taking. 7
  [HvModule]
setKillEnable                   = true
#   Voltage and Current RampSped currently set to arbitrary value
#   in percent / second
moduleVoltageRampSpeed          = 0.1
moduleCurrentRampSpeed          = 50
#   checkModuleTimeInterval       = 60, checks the status of the
#   module every 60 seconds during a Run, between two events
checkModuleTimeInterval         = 60
Next up, the [HvGroups] section in listing 10
defines the different groups that combine multiple channels. There are
multiple different kinds of groups in Wiener HV power supplies. The
important groups are ramping groups and trip groups. Essentially, if
one channel in a group starts ramping / trips all others also start
ramping / shut off the HV, respectively. The section in the config
file mainly exposes the already predefined sets of groups that are
relevant for the Septemboard detector in TOS.
    #   if this flag is set to true, anode and grid
#   will be coupled to one group
[HvGroups]
anodeGridGroupFlag              = true
#   grid is master channel of set on group
anodeGridGroupMasterChannel     = 4
anodeGridGroupNumber            = 0
monitorTripGroupFlag            = true
monitorTripGroupNumber          = 1
rampingGroupFlag                = true
rampingGroupNumber              = 2
gridChannelNumber               = 4
anodeChannelNumber              = 5
cathodeChannelNumber            = 8
After the [HvGroups] section is the definition of the individual HV
channels in listing 11. Here the physical
channels on the device are mapped to the desired voltages and current
bounds as well as to a human readable name. The fields repeat with
increasing prefix numbers.
  [HvChannels]
#   all currents given in A (vmecontrol shows mA)
0_Name                          = grid
0_Number                        = 5
0_VoltageSet                    = 300
0_VoltageNominal                = 500
0_VoltageBound                  = 2.5
0_CurrentSet                    = 0.000050
0_CurrentNominal                = 0.000500
0_CurrentBound                  = 0
Second to last is the [FADC] section in listing
12. As the name implies it configures all parameters
of the FADC. The main parameter to change is the
fadcTriggerThresholdRegisterAll parameter, which defines the trigger
threshold in effectively \(\si{mV}\). Depending on the amount of noise in
the system, adjustments to the threshold may be necessary.
  [Fadc] #   FADC Settings
fadcTriggerType                 = 3
fadcFrequency                   = 2
fadcPosttrig                    = 80
fadcPretrig                     = 15000
#   was 2033 before, 1966 corresponds to -40 mV
fadcTriggerThresholdRegisterAll = 1966
#   run time of a single pedestal run for the FADC in ms
fadcPedestalRunTime             = 100
#   number of acquisition runs done for each pedestal calibration
fadcPedestalNumRuns             = 10
#   using channel 0 on FADC as trigger source, thus bit 0 = 1!
fadcChannelSource               = 1
#   set FADC mode register (mainly to enable 14-bit readout)
fadcModeRegister                = 0b000
The last section of the configuration file is the [Temperature]
section, which deals with the safety ranges of the temperature of the
detector. If the temperature leaves the safe range, the detector is to
be shut down. 8
  [Temperature] #   temperature related parameters, all temps in °C
safeUpperTempIMB                = 61
safeUpperTempSeptem             = 61
safeLowerTempIMB                = 0
safeLowerTempSeptem             = 0
17.2.2.1. Understanding FADC settings extended
[ ]This should at least be an :extended: section with an explanation of all the fields that one can actually set.
Given the time since last working with this, I need to look up the values of the TOS config file in the FADC manual.
For reference our settings:
  [Fadc] #   FADC Settings
fadcTriggerType                 = 3
fadcFrequency                   = 2
fadcPosttrig                    = 80
fadcPretrig                     = 15000
#   was 2033 before, 1966 corresponds to -40 mV
fadcTriggerThresholdRegisterAll = 1966
#   run time of a single pedestal run for the FADC in ms
fadcPedestalRunTime             = 100
#   number of acquisition runs done for each pedestal calibration
fadcPedestalNumRuns             = 10
#   using channel 0 on FADC as trigger source, thus bit 0  1!
fadcChannelSource               = 1
#   set FADC mode register (mainly to enable 14-bit readout)
fadcModeRegister                = 0b000
FP_FREQUENCY is the name for the address 0x01 for the. It needs 6
bits of data:
  Bits 0-5 Function
Val = 1 => Fsample = 2GHz.
Val = 2 => Fsample = 1GHz.
Val = 4 => Fsample = 500MHz.
Val = 5 => Fsample = 400MHz.
Val = 10 => Fsample = 200MHz.
Val = 20 => Fsample = 100MHz.
Val = 40 => Fsample = 50MHz.
As such our used value of fadcFrequency = 2 corresponds to
\(\SI{1}{GHz}\) as I remembered.
MODE_REGISTER is for value 0x03 and its 3 bits of data.
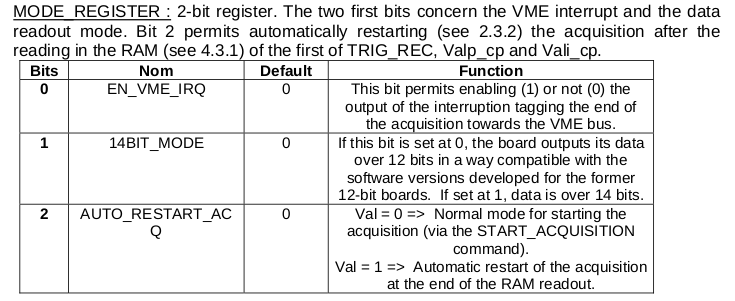 Our value of
 0b000 for the data means no interruption tagging, 12
bits data output and normal acquisition mode.
The fadcTriggerThresholdRegisterAll controls the trigger threshold
of the FADC. See (CAEN 2010) page 31-32:
TRIGGER THRESHOLD DAC : common pre-loading register of the DACs. This 12-bit register covers the range from –1V (000) to +1V (FFF). By USB or GPIB, one has access to the MSBs and LSBs via 2 distinct sub-addresses. The access is necessarily made in the order MSB (0B) then LSB (0A). By VME, the access is made via a single sub-address (0A). After loading of this register, one must transfer the value in the analog converter via the LOADTRIGGER THRESHOLD DAC (09) command.
This implies the trigger is calculated by:
    import unchained
const U_range = 2.V
const DAC_range = 4096
proc threshold  (x: float  ): MilliVolt =
  result = (  U_range / DAC_range * x - 1.V  ).to(mV)
echo threshold(  1966.0  )
which precisely reproduces our \(\SI{-40}{mV}\) number.
17.2.3. HV control via TOS
As is being alluded to in the previous section 17.2.2, the HV control built into TOS can also handle ramping the channels of the detector. This is particularly convenient as it offers a very smooth ramping mode, which keeps the voltage potentials between all channels under a constant ratio. This allows for automatic ramping even for highly sensitive channels (like the GridPix grid).
In order to use the HV control and ramp the channels via TOS,
ActivateHFM must be followed by InitHV, which attempts to connect
to the HV power supply using the configuration of the config file. If
the channels are not ramped up, a call to RampChannels will start
the smooth ramping process (see listing 14).
  > ActivateHFM
> InitHV
> RampChannels
If the HV is to be ramped down, a call to ShutdownHFM will ask
whether the channels should be ramped down. There are a multitude of
further commands available to communicate with the module, check the
voltages, print status information etc.
Note that TOS can be started without ramping the HV channels and stopped without ramping the channels down. It is capable of connecting to a running HV power supply or leave it running after shut down.
17.2.4. Temperature monitoring
The two MAX31685 micro controllers read out PT1000 sensors, a
group of \textbf{R}esistance \textbf{T}emperature \textbf{S}ensors
(RTDs), which measure temperatures by its effect on the electrical
resistance. They are platinum based and have a resistance of
\(\SI{1000}{Ω}\) at \(\SI{0}{\celsius}\). As the expected change in
resistance is well understood, the temperature can be precisely
measured.
The micro controller communicates with another micro controller, an
MCP2210 via the \textbf{S}erial \textbf{P}eripheral
\textbf{I}nterface (SPI). SPI allows to address both MAX31685 from
the single MCP2210. The MCP2210 is a USB-to-SPI micro
controller. The USB connection from the intermediate board with the
computer is separate from the rest of the detector
communication. TOS communicates with it via the standard
\textbf{H}uman \textbf{I}nteface \textbf{D}evice (HID) driver and
utilizes an existing open source library for the MCP2210
(Wong 2013), which is slightly adapted.
The ActivateHFM command mentioned in the previous section also
attempts to find the USB device of the MCP2210 (the two are
intertwined mainly, as the Septemboard detector is the only detector
with either of the two features). If it is found, temperature logging
starts immediately and the log files are placed in the default log
directory of the TOS repository. Once a data taking run starts,
the logging location is moved over to the data storage directory of
the run. In either case the log file is named temp_log.txt and
contains one temperature value for the intermediate board sensor
(Temp_IMB) and one for the carrier board sensor (Temp_Septem)
computed – based on an average over \(\SI{5}{s}\) – and a timestamp
(DateTime). A short snippet of the temperature log is shown in listing
15. 9
    #   Temperature log file
#   Temp_IMB  Temp_Septem   DateTime
26.5186     42.1472       2019-02-16.16:11:45
26.5217     42.2798       2019-02-16.16:11:51
26.5202     42.4371       2019-02-16.16:11:57
26.5309     42.5944       2019-02-16.16:12:03
26.5324     42.7347       2019-02-16.16:12:09
26.5355     42.8627       2019-02-16.16:12:15
26.5416     42.9707       2019-02-16.16:12:21
26.5432     43.0771       2019-02-16.16:12:27
26.5616     43.1804       2019-02-16.16:12:33
...
17.2.5. TOS development extended
As mentioned in one of the footnotes in the previous section, there are nowadays 2 independent versions of TOS.
The detector used for CAST in 2014/15 (and thus its successor used in this thesis) was based on a readout using the Virtex 6 FPGA. This system was, at the point I started on my master thesis in 2015, already quite diverged from the SRS based system, which was mainly developed for multi chip detectors that were initially planned for a large GridPix based TPC to be used for the ILD (the detector planned for the ILC, the International Linear Collider to be built in Japan).
In addition there was recent a master thesis (by Alexander Deisting (Deisting 2014)), which included work on using an FADC to read out the induced charges on the grid of the InGrid by decoupling the signal using a capacitor. The software library to interact with the used FADC had partially been implemented into the Virtex 6 TOS.
As the FADC was an integral part in the new detector design, it was natural to start with the Virtex 6 version.
At the same time the SRS TOS version at the time was even more ugly than the same code paths in the Virtex 6 TOS, due to its hardcoded extra loops for each FEC of the TOS. At a later time the SRS TOS was required for other detectors and so development effort was spent on both systems unfortunately.
17.3. Septemboard event display
In order to monitor the data taking process while the detector is
running, an online event display tool was developed during the first
CAST data taking period in March 2017. It is a Python 10
based project making heavy use of matplotlib (Hunter 2007) for
an interactive view of both the Septemboard events as they are
recorded, the FADC readout as well as a general information header
about the current data taking run.
The backend consists of a multiprocessing architecture with multiple
worker processes. One process watches the current run directory for
changes and reads the raw data files, another performs basic event
reconstruction and a last one updates the current event to be
displayed. The main process renders the matplotlib based graphical
user interface (GUI) 11.
Fig. 1 shows the graphical user interface of the septemboard event display during a background run. General information about the current run and event is shown in the box at the top center. The top left box shows hit specific information for the current event. The current septemboard event is always shown in the left pane in a realistic layout of the septemboard. By default the Viridis 12 color scale is used in the display of the septemboard events, each shown as an image of \((256, 256)\) pixels. If a chip did not record any activity during an event, its plot remains white for easier identification of few hits compared to no hits. The color scale can be adjusted when starting the program and the images can be downsampled by any factor of 2 for better visibility, as is done in fig. 1. The right pane of the event display shows the last recorded event of the FADC. It does not automatically update the plot every time a new septemboard event is recorded, as there can be multiple events without FADC activity and it is useful to be able to glance at the last large event on the FADC. The filename is printed as the title of the plot to show which septemboard event it corresponds to.

The event display provides multiple forms of interactivity, such as an "auto follow" mode (the default in which new events are shown as they are recorded), a "playback" mode (walks through all events with a certain delay and general back and forth optionality. Further, a shortcut to save images directly exists, as well as simple computation of aggregate statistics of the current data taking period (different occupancy maps and simple histograms showing the number of hits per each event and chip).
All in all it provides a simple, but powerful way to monitor the detector activity online as it takes data. 13
Footnotes:
There are unfortunately 2 different versions of TOS, as development diverged for different readout systems. One version is for the Xilinx Virtex-6 (V6) ML605 evaluation board and the other for the \textbf{S}calable \textbf{R}eadout \textbf{S}ystem (SRS). The V6 version can read out only a single detector (with up to 8 Timepix ASICs), but supports readout of an Ortec FADC and controlling a Wiener HV module via VME. The SRS version instead supports neither of these additional features, but supports multiple detectors at the same time. The detector used in this thesis is read out using the Virtex-6 board.
As of writing this thesis, I don't remember why the choice was made to only use a single channel instead of using all 4 channels to extend the time interval (development of these things happened between 2015-2017). It's possible there were issues trying to combine all 4 channels. But it's also just as likely it was an oversight due to lack of time combined with the fact that a \(\SI{2.5}{μs}\) window is long enough for all intents and purposes. However, combining all 4 channels would even yield a long enough acquisition window when running in the \(\SI{2}{GHz}\) sampling mode. Similarly, the choice of the 12-bit readout mode may represent plenty resolution in ADC values, but it seems prudent to not use the 14-bit mode given availability. All in all it leaves me head scratching (and thinking the likely reason will have been lack of time and being happy things working in the first place at the time).
If running in \(\SI{1}{GHz}\) mode. Else it corresponds to \(\SI{100}{MHz}\) clocks.
The last 3 lines of the data portion
contain the trigger record, which is already printed by us in the
header part and the Valp_cp and Vali_cp registers, which are only
important if the FADC is used at a sampling frequency of \(<
\SI{1}{GHz}\), which is why we ignore it here.
If in doubt about what the base address of the HV
supply in the VME crate is, start one of the Wiener HV programs (for
example isegControl), as it auto detects the module and prints the
address.
The checkModuleTimeInterval setting
to check the HV status during the data taking was disabled at CAST, as
it caused issues due to false alarms of the HV status. Given that the
KillEnable flag was used, it was deemed unimportant. Attempting to
fix it would have caused possible data loss as it would have been
tested on the live detector.
The temperature safety range
is coupled to the checkModuleTimeInterval setting in the previous
footnote. It was disabled together with the above during actual data
taking.
This default temperature logging location was also used as an unintended fallback mechanism during data taking, if the HV of the detector was considered out of certain bounds. Unfortunately, the bounds checking was entangled with the HV module sanity checks. As both features were very only implemented shortly before data taking, they triggered data taking aborts. For that reason the feature was disabled manually in code for the data taking at CAST. This however triggered a secondary code path for the temperature logging, storing it in the default location outside the specific run directories. As an effect the majority of CAST temperature logging data has been lost, as most of it was overwritten several times. Roughly daily manual temperature measurements are still left and show the detector operating in a good temperature range. Precise correlations with certain detector behaviors are unfortunately impossible. The two different code paths for the temperature logging are essentially a bug in the code that was never intended, stemming from the fact that temperature logging must be done to a 'global' location outside of data taking (as no data taking specific directory exists). Due to how the temperature logging and HV & FADC controls were added to TOS, these things were more entangled than necessary. A more thorough testing period of the detector and software package should have been performed, but was not in scope.
matplotlib provides a multitude of different GUI
backends. The explicit choice depends on the specific machine
(available backends may differ) and preference. Common choices are GTK
and TkAg. https://matplotlib.org/stable/users/explain/figure/backends.html
See here for the introduction of Viridis and its siblings: https://bids.github.io/colormap/
The main drawbacks are related to it being a
Python based project that utilizes matplotlib possibly too
heavily. The combination means the tool is not useful for fast data
taking, as it is too slow to show events in real time if data taking
exceeds one frame per second significantly.